Our clients have just received their first AMU Dashboard and summary sheet.
Background
Antimicrobial Resistance (AMR) has been on the radar for the past few years. The idea of ‘superbugs’ which can’t be killed by any antibiotic is scary, and so there’s been a lot of attention on minimizing this risk. Early in the discussion, the amount of antibiotics used on farms was highlighted. Globally, around 80% of all antibiotics used are used in agriculture. However, we were able to show in a research paper published in 2016 that NZ agriculture is in fact the 3rd lowest user of antibiotics globally. Having said all that, the goal of using less antibiotics and focusing more on preventive animal health makes sense from not just an AMR perspective but an economic perspective. Happy, healthy animals produce more and do so more efficiently.
Why a dashboard?
Although NZ Ag is a low user of antimicrobials (AM), the goal is to reduce the reliance on them even further, to prevent the risk of antimicrobial resistance (AMR). We’ve developed this comprehensive dashboard that gives clients a detailed look into their AMU.
What does it tell me?
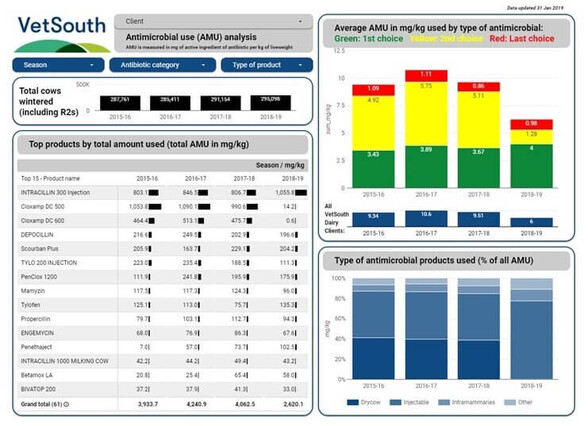
From the dashboard, clients can see how their overall use has changed over the past 4 years. They can see what types of AMs they are using less or more of; and can benchmark themselves against the rest of our dairy farm clients. All of the AMs listed along with the contribution they make to the farm's overall AMU. They will see their cow numbers (which is part of the calculation). There’s also a graph that shows what type of AMs are being used.
How is it calculated?
The calculation uses PCU- population corrected usage. This takes the total weight of AMs and divides it by the total weight of animals. This means that it is comparable across farms, regions, species, countries. The numbers of cows wintered represents the total weight of animals. We have to take a spot in time and this is the most reliable measure. The antibiotics used are from 1st June to 31st May for each season.
Where can I find out more?
VetSouth has been very active in the AMR and AMU space. We currently have a region-wide project looking at strategies to reduce AMU across all farms. If you would like to be involved with this please contact Mark (markb@vetsouth.co.nz) and put ‘SFF AMU’ project in the title line. As part of that project, and in conjunction with our other work, we will be running a series of short farmer seminars and workshops on AMR and AMU over the next few months. If you’d like to find out more look out for these in your area. We’ll also be presenting a workshop at SIDE in Invercargill this year.
- Mark Bryan
